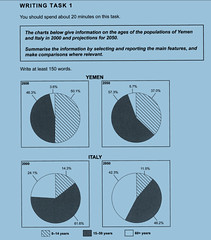
The charts below give information on the ages of the population of Yemen and Italy in 2000 and projections for 2050.
Summarize the information by selecting and reporting the main features, and make comparisons where relevant.
http://farm4.staticflickr.com/3740/9536264122_91d57cf82c_m.jpg
Given are figure concerning the ages of residents of Yemen and Italy in 2000, as well as the forecasts for 2050. In general, it can be seen that the 15-59 years-old is the group accounting for the biggest proportion.
In 2000, the figure for 0-14 years of age in Yemen was ahead of that in Italy by a wide margin, 50.1% for the former and 14.3 % for the latter. To turn to people aged between 15 and 59, the figure for Italy was 61.6%, as against 46.3 for Yemen. In the oldest age group Italy's over-60-year-olds was nearly 8 times as many as Yemen's, with 24.1% and 3.6% respectively.
It is pre...
| Post date | Users | Rates | Link to Content |
|---|---|---|---|
| 2013-08-18 | mandy19.2q | 76 | view |

- The restoration of the old building in the major cities throughout the world involves the enormous expenditure This money would bring more benefits if it is used to provide new housing and road development To what extent do you agree or disagree with this 94

- The graph and table below give information about water use worldwide and water consumption in two different countries 93
- The position of women has changed markedly in the last thirty years or so. Many of the problems young people now experience, such as juvenile delinquency, arise from the fact that many married women now work and are not at home to care for their children. 95
- Some people believe that secondary school children should study international news as a subject other say that this is wasting time Discuss both view and give your opinion 85
- Every year several languages die out. Some people think that this is not important because life will be easier if there are fewer languages in the world.To what extent do you agree or disagree with this opinion? 65
Sentence: Given are figure concerning the ages of residents of Yemen and Italy in 2000, as well as the forecasts for 2050.
Description: The fragment figure concerning the is not usually preceded by are
Suggestion: Possible agreement error: Replace figure with figures
Attribute Value Ideal
Score: 7.5 out of 9
Category: Very Good Excellent
No. of Grammatical Errors: 1 2
No. of Spelling Errors: 0 2
No. of Sentences: 10 10
No. of Words: 224 200
No. of Characters: 929 1000
No. of Different Words: 111 100
Fourth Root of Number of Words: 3.869 4.0
Average Word Length: 4.147 4.6
Word Length SD: 2.212 2.4
No. of Words greater than 5 chars: 45 60
No. of Words greater than 6 chars: 30 50
No. of Words greater than 7 chars: 19 40
No. of Words greater than 8 chars: 15 20
Use of Passive Voice (%): 0 0
Avg. Sentence Length: 22.4 21.0
Sentence Length SD: 5.314 7.5
Use of Discourse Markers (%): 0.3 0.12
Sentence-Text Coherence: 0.438 0.35
Sentence-Para Coherence: 0.597 0.50
Sentence-Sentence Coherence: 0.095 0.07
Number of Paragraphs: 3 4