IELTS Writing Task 1
The chart below shows the proportions of the world’s oil resources held in different areas, together with the proportions consumed annually in the same areas.
Summarise the information by selecting and reporting the main features, and make comparisons where relevant.
Write at least 150 words.
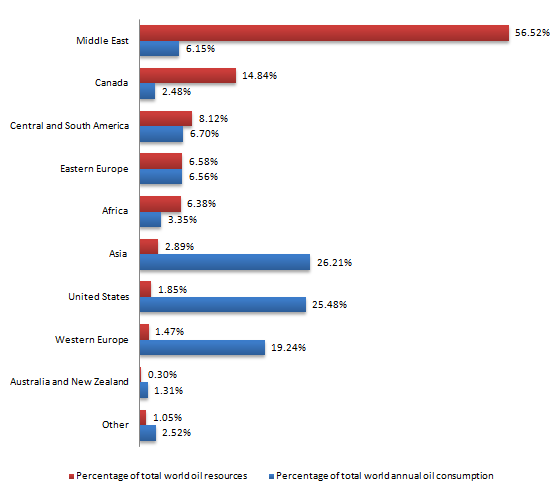
The chart below shows the proportions of the world’s oil resources held in Middle East, Canada, Central and South America, Eastern Europe, Africa, Asia, United States, Western Europe, Australia and New Zealand and other countries, as well as the percentage of their annual oil consumptions.
From the red graph, the percentage of total world oil resources, Middle East has the highest percentage of 56.52%. Followed by Canada, Central and South America, Eastern Europe, Africa, Asia, United States, Western Europe, other and Australia and New Zealand with 14.48%, 8.12%, 6.58%, 6.38%, 2.89%, 1.85%, 1.47%, 1.05% and 0.30% respectively.
From the blue graph, the percentage of total world annual oil consumption, Asia has the highest percentage of 26.21%. Followed by United States, Western Europe, Central and South America, Eastern Europe, Middle East, Africa, other, Canada and Australia and New Zealand, with 25.48%, 19.24%, 6.70%, 6.56%, 6.15%, 3.35%, 2.52%, 2.48% and 1.31% respectively. Countries like Africa, Asia, United States, Western Europe, Australia and New Zealand and Other all consumed more oil than what they had.

- Some say all offenders should be sent to prison, other argue that there are better alternatives such as community work for those who commit minor crimes. Discuss both viewers and give your opinions. 53
- Writing Task 1 at least 150 words The table below shows CO2 emissions for different forms of transport in the European Union The Pie Chart shows the percentage of European Union funds being spent on different forms of transport Write a report for a univer 78

- The costs of medical health care are increasing all the time. Governments are finding it difficult to balance the health care budget.Should citizens be totally responsible for their own health costs and take out private health insurance, or is it better t 68
- Writing Task 1 at least 150 words The diagrams below show the site of a school in 2004 and the plan for changes to the school site on 2024 summarize the information by selecting and reporting the main features and make comparisons where relevant 76
- Writing Task 1 (at least 150 words)The graph below shows the total value of exports and the value of fuel, food and manufactured goods exported by one country from 2000 to 2005.summarize the information by selecting and reporting the main features, and ma 73
flaws:
Number of Paragraphs: 3 4
better to have one more paragraph for conclusion: what did you get from the graph.
Attribute Value Ideal
Score: 6.0 out of 9
Category: Good Excellent
No. of Grammatical Errors: 0 2
No. of Spelling Errors: 0 2
No. of Sentences: 6 9
No. of Words: 172 200
No. of Characters: 885 1000
No. of Different Words: 80 100
Fourth Root of Number of Words: 3.621 4.7
Average Word Length: 5.145 4.6
Word Length SD: 2.266 2.4
No. of Words greater than 5 chars: 68 60
No. of Words greater than 6 chars: 41 50
No. of Words greater than 7 chars: 21 40
No. of Words greater than 8 chars: 18 20
Use of Passive Voice (%): 0 0
Avg. Sentence Length: 28.667 21.0
Sentence Length SD: 9.534 7.5
Use of Discourse Markers (%): 0.167 0.12
Sentence-Text Coherence: 0.633 0.35
Sentence-Para Coherence: 0.729 0.50
Sentence-Sentence Coherence: 0.135 0.07
Number of Paragraphs: 3 4