Writing Task 1 (at least 150 words)
The table below shows CO2 emissions for different forms of transport in the European Union. The Pie Chart shows the percentage of European Union funds being spent on different forms of transport.
Write a report for a university lecturer describing the information shown below.
image 1:
http://ielts.studyhorror.com/resources/upImages/writings/2011/10/13/iel…
image 2:
http://www.examenglish.mobi/IELTS/images/eufunds.gif
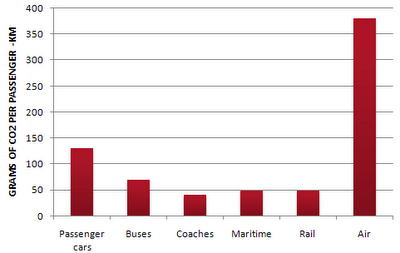
The table shows the result of the amount of CO2 emissions for different forms of transport in the European Union and from the Pie Chart, we can see which form of transport has a highest percentage of European Union funds being spent on.
From the table, air has the highest amount of CO2 emission per passenger kilometre of more than 350 grams. Followed by Passenger cars, Buses, Maritime, Rail and then Coaches of 125 grams, 60 grams, 49 grams and 45 grams respectively.
From the Pie Chart, Roads had the highest percentage of EU Funds for transport 2007-2013 of 52%. Followed by Railways, Publ...

- Celebrities such as singers and film stars earn too much money buy too many goods and care too little about other people to what extent do you think this is true should anything be done to change the situation 71
- Compare the advantages and disadvantages of three of the following as media for communicating information State which you consider to be the most effective comics books radio television film theatre 75
- In many countries today insufficient respect is shown to older people What do you think may be the reasons for this What problems might this cause in society Give reasons for your answer and include any relevant examples from your own knowledge or experie 71
- some people think that strict punishments for driving offences are the key to reducing traffic accidents Others however believe that other measures would be more effective in improving road safety Discuss both these views and give your own opinion 70
- IELTS Writing Task 1 The chart below shows the proportions of the world’s oil resources held in different areas, together with the proportions consumed annually in the same areas.Summarise the information by selecting and reporting the main features, and 48
Sentence: The table shows the result of the amount of CO2 emissions for different forms of transport in the European Union and from the Pie Chart, we can see which form of transport has a highest percentage of European Union funds being spent on.
Description: The token a is not usually followed by an adjective, superlative
Suggestion: Refer to a and highest
Attribute Value Ideal
Score: 7.0 out of 9
Category: Good Excellent
No. of Grammatical Errors: 1 2
No. of Spelling Errors: 0 2
No. of Sentences: 7 9
No. of Words: 188 200
No. of Characters: 884 900
No. of Different Words: 87 100
Fourth Root of Number of Words: 3.703 4.7
Average Word Length: 4.702 4.6
Word Length SD: 2.555 2.4
No. of Words greater than 5 chars: 55 60
No. of Words greater than 6 chars: 45 50
No. of Words greater than 7 chars: 38 40
No. of Words greater than 8 chars: 25 20
Use of Passive Voice (%): 0 0
Avg. Sentence Length: 26.857 21.0
Sentence Length SD: 9.523 7.5
Use of Discourse Markers (%): 0.429 0.12
Sentence-Text Coherence: 0.528 0.35
Sentence-Para Coherence: 0.793 0.50
Sentence-Sentence Coherence: 0.167 0.07
Number of Paragraphs: 4 4