Writing Task 1 (at least 150 words)
The table below shows CO2 emissions for different forms of transport in the European Union. The Pie Chart shows the percentage of European Union funds being spent on different forms of transport.
Write a report for a university lecturer describing the information shown below.
image 1:
http://ielts.studyhorror.com/resources/upImages/writings/2011/10/13/iel…
image 2:
http://www.examenglish.mobi/IELTS/images/eufunds.gif
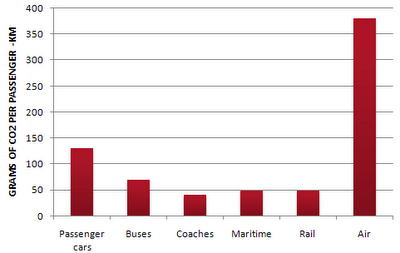
The table shows the result of the amount of CO2 emissions for different forms of transport in the European Union and from the Pie Chart, we can see which form of transport has a highest percentage of European Union funds being spent on.
From the table, air has the highest amount of CO2 emission per passenger kilometre of more than 350 grams. Followed by Passenger cars, Buses, Maritime, Rail and then Coaches of 125 grams, 60 grams, 49 grams and 45 grams respectively.
From the Pie Chart, Roads had the highest percentage of EU Funds for transport 2007-2013 of 52%. Followed by Railways, Publ...

- Writing Task 1-Write at least 150 words. The graphs below give information about computer ownership as a percentage of thepopulation between 2002 and 2010, and by level of education for the years 2002 and2010.Summarise the information by selecting and rep 60
- Writing Task 1 at least 150 words The graphs below provide information on global population gures and gures for urban populations in different world regions Summarise the information by selecting and reporting the main features and make comparisons where 80

- A person s worth nowadays seems to be judged according to social status and material possessions Old fashioned values such as honour kindness and trust no longer seem important To what extent do you agree or disagree with this opinion 67
- Compare the advantages and disadvantages of three of the following as media for communicating information State which you consider to be the most effective comics books radio television film theatre 75
- Writing Task 1 (at least 150 words)The graph below shows the total value of exports and the value of fuel, food and manufactured goods exported by one country from 2000 to 2005.summarize the information by selecting and reporting the main features, and ma 73
Sentence: The table shows the result of the amount of CO2 emissions for different forms of transport in the European Union and from the Pie Chart, we can see which form of transport has a highest percentage of European Union funds being spent on.
Description: The token a is not usually followed by an adjective, superlative
Suggestion: Refer to a and highest
Attribute Value Ideal
Score: 7.0 out of 9
Category: Good Excellent
No. of Grammatical Errors: 1 2
No. of Spelling Errors: 0 2
No. of Sentences: 7 9
No. of Words: 188 200
No. of Characters: 884 900
No. of Different Words: 87 100
Fourth Root of Number of Words: 3.703 4.7
Average Word Length: 4.702 4.6
Word Length SD: 2.555 2.4
No. of Words greater than 5 chars: 55 60
No. of Words greater than 6 chars: 45 50
No. of Words greater than 7 chars: 38 40
No. of Words greater than 8 chars: 25 20
Use of Passive Voice (%): 0 0
Avg. Sentence Length: 26.857 21.0
Sentence Length SD: 9.523 7.5
Use of Discourse Markers (%): 0.429 0.12
Sentence-Text Coherence: 0.528 0.35
Sentence-Para Coherence: 0.793 0.50
Sentence-Sentence Coherence: 0.167 0.07
Number of Paragraphs: 4 4